Relationship between corporate sustainability performance and corporate financial performance
According to the traditional perspective, sustainable development is defined as growth that satisfies current demands without jeopardizing the ability of future generations to satisfy their own needs (WCED, 1987, p. 41). Over time, the idea of sustainable development has changed, slowly focusing less on environmental issues and more on social and economic issues, in addition to changing from the global level to national, local, and even corporate levels (Giovannoni &Fabietti, 2013, pp. 23- 28). Nowadays, it is widely believed that even though businesses contribute to social injustice and environmental degradation, they are essential to the implementation of sustainability initiatives because of their significant potential to shape societal norms and foster innovation (Gray, 2010, pp. 56–58).
Meeting the demands of the company's immediate and long-term stakeholders without jeopardizing its ability to do so is what is meant by corporate sustainability (Dyllick&Hockerts, 2012, p. 131). Businesses must simultaneously maintain and grow their economic, environmental, and social capital to satisfy the demands of numerous stakeholder groups and encompass all three paradigms of sustainability (Oželienė, 2017, pp. 97–101). It is important to stress that strong governance, which is currently regarded as the last or 4th paradigm of corporate sustainability, is a prerequisite for the economic, environmental, and social sustainability of a corporation. When organizational members who are personally invested in the success of a company's mission follow corporate sustainability principles and practices, working in the ESG dimensions improves. This improves stakeholder satisfaction, which raises the company's character and brand equity (Kantabutra & Ketprapakorn, 2020, pp. 18–19). Additionally, the scientists looking into the CSP-CFP connection only consider company sustainability performance in terms of the environmental, social, and governance dimensions.
Such an incomplete research strategy should be supplemented to give managers who adopt various initiatives to boost performance in specific areas of corporate sustainability the full range of knowledge about the effects of Corporate Sustainability Performance on Corporate Financial Performance. Given the corporate sustainability model that is described in this paper and the contentious findings of empirical research on the connection amongst CSP across all of its specific dimensions, the paper's main objective is to provide an answer to the question of whether an increase in a company's overall revenues results in an increase in corporate sustainability performance across all of its specific dimensions. The largest U.S. firms were the subject of an empirical study using panel regression models from 2015 to 2019 to achieve the article's objective. These panel regression models, which incorporate variables for corporate sustainability ratings, are based on the Cobb-Douglas production function. The Breusch-Pagan test and the Hausman test, which comprises of F test, have been used to choose between the pooled OLS model, random-effects model, and fixed-effects model. Additionally examined were the illustrative statistics and Pearson correlation coefficients shown in the literature review. Followed by that is the description of the methodology and results and the conclusion.
Literature Review
Perrini et al. (2011, pp. 59–76) provided the Corporate Sustainable Performance-Corporate Financial Performance multilevel framework, in which it incorporated Corporate Social Responsibility in specific management regions, which include inner group, customers, delivery chain, society, natural environment, and company governance, can affect sales and fee-related firm outcomes by having an effect on, as an example, personnel' pride and patron consider, as well as recognition, innovativeness, and reliability of a company, which can then affect the corporation's performance in terms of revenue and expenses. Tang et al. (2018) used financial data from the ten-year group for each of one hundred thirty organizations and environmental, social, and governance (ESG) elements (ROA). In line with their empirical research, the rate of CSR implementation has no pertaining to the connection between its ROA; however, ROA is better when an organization engages in inner CSR before transferring directly to outside CSR, taking under consideration the relationships between numerous CSR dimensions to create synergies, processes CSR sports as per a scientific way.
Wagner (2010, pp. 1553–1560) collected information on domestic-level sustainability performance from twenty-two countries to ascertain how it influences the relationship between CSP and CFP. It showed that a positive Corporate Sustainability Performance -Corporate Financial Performance relation is negatively impacted by the country-level sustainability performance. Jha and Rangarajan (2020, pp. 1–30) conducted research of 715 organizations from 80nations based on data for social and environmental performance as well as return on equity (ROE) from 2013 to 2015 to understand the channels through which access to finance and environmental financing sustainability performance can have an impact on the business performance of banks. They concluded that access to capital and environmental finance has a favorable effect on banks' return on equity after calculating a number of regression models. In contrast, management excellence and loan growth in the case of environmental financing are the most important factors that have a favorable impact on financial performance.
For the elite 600 Indian corporations between the years of 2008 and 2018, the environmental dimension score and the ESG ratings have a significant negative impact on ROA, according to the estimation of their fixed effects model. Still none of the CSPs has a significant positive impact on ROE. The environmental and governance element scores, as well as the ESG score, have a considerable negative impact on Tobin's q. What's more, when they looked at the opposite relationship, they discovered the same substantial negative effects.
The relationship between CSP and CFP, as expressed by financial and market actions, has been studied to ascertain the impact of overall CSP in addition to its specific components, such as ESG performance, on CFP in various industries and countries. Furthermore, researchers looked at how CFP is impacted by CSR initiatives comparable to corporate sustainability if they aim to make long-term improvements to the environment, society, and economy (Ashafi et al., 2018, p. 678). However, because they provide contradicting findings, earlier empirical research does not permit a clear-cut assessment of the relationship between corporate sustainability performance (CSP) and corporate financial performance (CFP). By using a meta-analysis of studies within the group of 200 that included a total sample of 33,020 observations, Lu and Taylor (2016, pp. 1–15) showed that the relationship between corporate sustainability and financial performance can depend on the metrics used to measure CSP and CFP in addition to the sample, time, and research methodology. To conclude, it should be noted that all scientists tend to pay more attention to the CSP in the ESG dimensions than the ESP, even though research on the relationship between CSP and CFP is widespread and diverse based on the research methodology adopted and the findings obtained. This research gap in earlier scientific studies served as an impetus for the author's investigation into the CSP-CFP relationship. As a result, economic sustainability performance has been added as a variable to estimated panel regression models alongside other CSPs.
Research Methodology
The largest non-financial U.S. companies that appeared in the top 100 spots of the Fortune 500 ranking in each of the years from 2016 to 2020 make up the research sample. By imposing this requirement on listed corporations, it was possible to include a sizable number of businesses in the research sample, all of which had stable top rankings. Based on the initial criterion, 69 firms were eligible for the research sample, but twelve of them were disqualified because their activity had changed as a result of an acquisition, they were operating as privately held companies or government-sponsored enterprises, or they lacked important data for the entire analysis period. The final research sample is a balanced panel dataset of 57 businesses during the five-year research period with 285 firm-year observations. Although the study's time frame is 2015–2019, it was necessary to gather all necessary data for the years 2014–2019 since we used variables with a one-year lag and variables with average values presented. Gretl statistical software was used for all calculations based on these data, and the Refinitiv Thomson Reuters Eikon database was used to obtain the financial and sustainability information for the companies under investigation from the years 2014 to 2019. The following research hypothesis was developed in light of the business model for sustainability (Kantabutra and Ketprapakorn, 2020, pp. 1–22), which Wagner (2010, pp. 1553–1560) underlined the need to integrate all of its elements and the results of his empirical investigations, which he conducted from 1992 to 2003 among the greatest U.S. firms.
H: CSP has a favorable impact on financial success as measured by total revenues, both at the aggregate and disaggregate levels.
As part of the empirical validation of the study hypothesis, the increased production function, which in its general form resembles the following, is utilized to estimate three regression models.:
V = V (K, L, X)
where V stands for value-added as the output, X is a vector of company sustainability scores, and K and L stand for the capital and labor inputs, respectively. A Cobb-Douglas production function, which has the following formula, is used to operationalize the general form of an enhanced production function (Conte & Svejnar, 1988, pp. 139–151)
which in a logarithm form becomes:
Three operating variables are constructed from the data collected.
- V (output) – the primary criterion for identifying the largest American corporations in the Fortune 500 ranking is the value of total revenues,
- K (capital input) – average fixed value assets and
- L (labor input) – the average number of employees.
Considering constructed variables as well as denoting companies by i, the time period in years by t (t = 1, 2, …) and residual by μ, the basic Cobb-Douglas production function is:
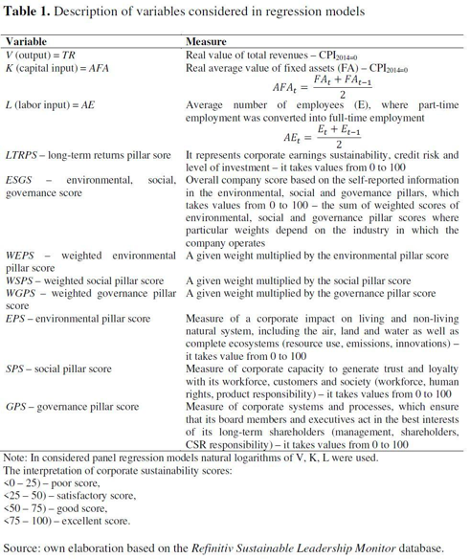
Three regression models are used below, differing in the vector X (see Table 1), to reach the aim of this paper, are considered.
1ST model is where vector X is composed of
-LTRPS- Long-term returns pillar score, assesses an organization's capacity to oversee its long-term economic viability and
- ESGS- The environmental, social, and governance score (ESGS) is an overall score based on the weighted scores of the pillar scores.
2nd model where vector X includes the weighted scores of specific pillars as well as the long-term returns pillar score (LTRPS).
− WEPS– weighted environmental pillar score,
− WSPS– weighted social pillar score and
− WGPS– weighted governance pillar score.
3rd Model is based on the theory that vector X disaggregates pillar scores without weights and the long-term returns pillar score (LTRPS):
- EPS- It is the environmental pillar score demonstrates how well a business manages environmental risk and seizes environmental opportunities.
- SPS- It stands for "social pillar score," which describes the standing of the business's operating permit and reputation, as well as
- GPS- The governance pillar score (GPS) of a corporation measures how well it can manage its rights and obligations.
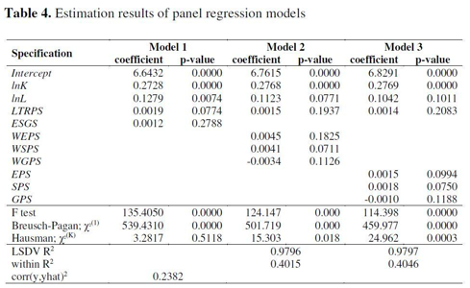
After examining the findings of the F test, the Breusch-Pagan (BP) test, and the Hausman test, the choice of whether to estimate the examined regression models using a pooled OLS, fixed-effects, or random-effects panel model was made (see Table 4). Because the p-values for the F test and the BP test were lower than 0.05 and the p-value for the Hausman test was higher than 0.05, the random-effects model should be used in the first regression model. The p-values for all tests in the following two regression models were all less than 0.05, indicating that the fixed-effects model should be used in these circumstances. Additionally, the study provides evaluations of descriptive statistics and Pearson correlation coefficients for the variables considered in regression models.
Results
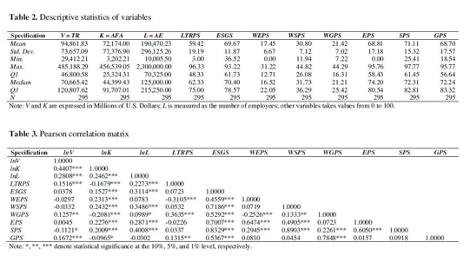
For this study, the 57 biggest U.S. corporations from the years 2015 through 2019 are analyzed, making up the 285 firm-year observations that make up the research sample. These businesses have offices in many states and operate in various industries. The group of businesses with the most members is the healthcare industry. In Texas, there are eight corporate headquarters and eight in California. Total sales, the primary factor used to rank the largest U.S. corporations in the Fortune 500 ranking and to determine the output of the regression models under consideration, ranged from 28,212.20 to 475,054.34 million$. Walmart Inc. consistently ranked #1 among the Fortune 500 companies from 2016 through 2020 and reported the highest overall revenues in 2019. Exelon Corp. had the lowest total revenues in 2015 and the highest in 2017, when the company was ranked 89th. The mean total revenue for all firm-year observations is USD 92,540.23 million, while the median is USD 68,425.13 million. At&T Inc. had the highest average fixed asset value in 2019 ($456,539.05 million), and Best Buy Co., Inc. had the lowest average fixed asset value in 2017 ($3,105.11 million) (mean is USD 62,243.12 million and the median is USD 42,234.75 million). Walmart Inc. had the highest average employment indicating labor input in 2015 and 2016 with 2,250,000 employees, while Valero Energy Corp. had the lowest average employment indicating labor input in 2017 with 100,550 workforces (mean is 189,320.12 and median is 122,500 employees). Walmart is the biggest American corporation in relation to overall revenues, average employment, and average fixed asset value, which from 2015 to 2019, was stronger than the mean for all firm-year observations.
In terms of business sustainability scores, the average for the LTRP is 58.32, while the average for the combined ESG scores is 68.54. Costco Wholesale Corp. had the greatest LTRP score (96.33, which is a good score), while Boeing Co. had the lowest (3.00, which is a terrible score), both in 2015 and 2019. Microsoft Corp. received the greatest overall ESG score (92.13, an exceptional score), while Phillips 66 Co. received the lowest overall score (36.52, a good score). It is important to highlight that a minimum of 20% of the LTRP scores were at most at the satisfactory level (Q1 = 47.24), and a minimum of 30% of the combined ESG scores were at most at the good level (Q1 = 61.73). The means of specific weighted ESG pillar scores that were derived from industry-specific weights and aggregated pillar scores and then totaled up to obtain an overall ESG score are 16.23, 31.70, and 20.32, respectively. All of the top disaggregated pillar scores, including governance (94.56; Best Buy Co., Inc./2019), social (96.66; IBM Corporation.), and environmental (94.35; Target Corp./2016), were at the exceptional level. The lowest scores in the social pillar (24.32 — Cardinal Health Inc./2015) can be considered acceptable, while the lowest scores in the governance pillar (0.00 — Amerisource-Bergen Corporation. /2015) and environmental pillar (0.00 — Oracle Corporation. /2017) were at a weak level. 75% of all scores for the ESG pillars were stronger than the corresponding values for Q1 (58.43, 61.45, and 56.64), indicating that at least 75% of all observations in those pillars were at least at an excellent level (Table 2).
Total revenues (TR), a dependent variable, and a few independent variables have statistically significant relationships, according to the correlation analysis (see Table 3). While there is a poor association between TR and average employment (AE), there is a moderate correlation between TR and the average value of fixed assets (AFA) (rxy = 0.4407). At the 0.01 level, both associations are statistically significant and positive. Different outcomes are seen when correlations between TR and business sustainability scores are analyzed. The long-term returns pillar score (LTRPS) and TR have a positive but modest (rxy = 0.1516) connection that is statistically significant at the 0.01 level. While the DSPS (rxy = 0.1121) is statistically significant at the threshold of 0.1, the correlation with the weighted social pillar score (WSPS) is statistically negligible. The correlations between TR and CSR scores show a poor and unfavorable association. The correlations between TR and corporate governance scores are trustworthy because they exhibit favorable and marginally significant relationships at levels of 0.05 and 0.01 for the correlation with the WGPS and the correlation with the DGPS, respectively (rxy = 0.1257 and 0.1672). It should be stressed that while explanatory variable correlations are taken into consideration in some regression models, they must not exceed the crucial threshold of|0.8|.
Conclusion
The empirical study revealed that the variables of company sustainability performance in the calculated panel regression models have statistically significant coefficients. Among other statistically significant coefficients, there are coefficients at the LTRPS (Model 1), the DEPS (Model 3), the WSPS (Model 2), and the DSPS (Model 3). More economical, environmental, and social sustainability leads to higher total profitability, according to most statistically significant coefficients (TR). Unfortunately, in the panel regression models that were considered, the coefficients at the overall sustainability performance ESGS — Model 1, WEPS — Model 2, WGPS — Model 2, and GPS — Model 3 are statistically insignificant. Due to some statistically insignificant coefficients present in estimated panel regression models, the research hypothesis, which presupposes a positive relationship between CSP, and CFP as expressed by TR, cannot be positively verified. It means that increasing a company's CSP in the ESG dimensions does not boost a company's overall revenues, despite the high institutionalization level of sustainable development principles and practices in the US and the resulting high sustainability level of the largest US companies.
Because of restrictions, the results provided by this empirical study shouldn't be simplified. Firstly, the weighted and disaggregated pillar scores, as well as the overall corporate sustainability scores that were retrieved from the Refinitiv Thomson Reuters Eikon database, are measures of corporate sustainability performance that are based on information provided by companies and do not remove subjectivism from the data. Additionally, the five-year research period seems too brief to thoroughly understand the CSP-CFP link. However, the primary factor in choosing such a brief analysis period was the unavailability of LTRPS estimates prior to 2014. Since, to the author's knowledge, this approach is not frequently used, despite the fact that economic sustainability is a crucial corporate sustainability dimension, it was necessary to incorporate it as a variable alongside other CSPs in EPRM. The novel study strategy indicates that CSP is taken into account together with CFP in ESG dimensions to provide more information about the relationship between CSP and CFP.
Abbreviations
- CSP- Corporate Sustainability Performance
- CSF- Corporate Financial Performance
- ESG- Environmental, Social, and Governance
- CSR- Corporate Social Responsibility
- ROE- Return on Equity
- LTRPS- Long Term Returns Pillar Score
- ESGS- Environmental, Social, and Governance Score
- WEPS- Weighted Environmental Pillar Score
- WSPS- Weighted Social Pillar Score
- WGPS- Weighted Governance Pillar Score
- EPS- Environmental Pillar Score
- SPS- Social Pillar Score
- GPS- Governance Pillar Score
- USD- United States Dollar
- TR- Total Revenues
Bibliography:
Ashafi, M., Adams, M., Walker T. R., & Magnan, G. (2018). How corporate social responsibility can be integrated into corporate sustainability: a theoretical review of their relationship. International Journal of Sustainable Development &World Ecology, 25(8), 672–682. doi: 10.1080/13504509.2018.1471628.
Conte, M. A., &Svejnar, J. (1988). Productivity effects of worker participation in management, profit-sharing, worker ownership of assets and unionization in U.S. firms. International Journal of Industrial Organization, 6(1), 139–151.doi: 10.1016/0167-7187(88)90011-2.
Dyllick, T., &Hockerts, K. (2012). Beyond the case for corporate sustainability. Business Strategy and the Environment, 11(2), 130–141. doi: 10.1002/bse.323.
Giovannoni, E., &Fabietti, G. (2013). What is sustainability? A review of the concept and its applications. In C. Busco, M. L. Frigo, P. Quattrone & A. Riccaboni (Eds.). Integrated reporting. Concepts and cases that redefine corporate accountability. Berlin: Springer, 21–40. doi: 10.1007/978-3-319-02168-3_2.
Gray, R. (2010). Is accounting for sustainability actually accounting for sustainability...and how would we know? An exploration of narratives of organisations and the planet. Accounting Organizations and Society, 35(1), 47–62. doi:10.1080/0969160X.2011.556420.
Jha, M. K., & Rangarajan, K. (2020). Analysis of corporate sustainability performance and corporate financial performance causal linkage in the Indian context. Asian Journal of Sustainability and Social Responsibility, 5(1), 1–30. doi: 10.1186/s41180-020-00038-z.
Kantabutra, S., Ketprapakorn, N. (2020). Toward a theory of corporate sustainability: a theoretical integration and exploration. Journal of Cleaner Production,270, 1–22. doi: 10.1016/j.jclepro.2020.122292.
Lu, L., & Taylor, M. (2016). Which factors moderate the relationship between sustainability performance and financial performance? A meta-analysis study. Journal of International Accounting Research, 15(1), 1–15. doi: 10.2308/jiar-51103.
Oželienė, D. (2017). A review of enterprise sustainable development models: critical appraisal. International Scientific Journal “Science. Business. Society”,2(2), 97–103.
Perrini, F., Russo, A., Tencati, A., &Vurro, C. (2011). Deconstructing the relationship between corporate social and financial performance. Journal of Business Ethics, 102(1), 59–76. doi: 10.1007/s10551-011-1194-1.
Tang, Z., Hull, C. E., & Rothenberg, S. (2018). How corporate social responsibilityengagement strategy moderates the CSR-financial performance relationship.Journal of Management Studies, 49(7), 1274–1303. doi: 10.1111/j.1467-6486.2012.01068.x
Wagner, M. (2010). The role of corporate sustainability performance for economic performance: a firm-level analysis of moderation effects. Ecological Economics, 69(7), 1553–1560. doi: 10.1016/j.ecolecon.2010.02.017.
World Commission on Environment and Development (WCED) (1987). Our common future. Oxford: Oxford University Press.
Author: Aditya Saraf, student LIGS University
Approved by: Dr. Minh Nguyen, lecturer LIGS University