

Forecasting Valuation Comparing ARIMA vs Prophet
In this study, we limit the forecasting period to one year since the same method is applicable to more than one year. The reason for that is the only five-year historic data we have for Discount Cash Flow (DCF) and six years for Price Earning (P/E) and Price to Sale (P/S) valuation. We use a time series approach for comparison, so we use the last given year, which is 2018, for comparison with the predicted value based on all previous years. So, in this study, we compare the predicted 2018 year Using ARIMA and Prophet Methods with the real 2018 year. Some steps were taken to make forecasting and rebuild time series and apply forecasting methodologies. The errors between real data and the forecasted data for both methods showed almost similar results.
Introduction
Financial analysis is one of the most important parts of financial analysis that investors really use to make decisions. In this research work, we proposed evaluating three valuation methods and establishing decision-making based on the forecasted values. In this study, we limit the study to a one-year forecast since the same strategy can be extended in future years. Investors in general like prediction to manage risk. In this analysis, we propose a forecast of valuations based on historical yearly data that we retrieved from the financial API.
For this project, we had to investigate how to value companies using a variety of methods, including DCF, P/E, and P/S, all of which were influenced by investor behavior. We look at different ways to value companies because different types of investors value companies in different ways. A value investor doesn’t value companies the same way that a growth investor does when it comes to picking target prices. And the reason we look at several different valuation methodologies is because one of them can be wrong, but if you look at three and take an average of all three, we can normalize the error, thus minimizing the error.
Value investors (VI) have a preference for cheap stocks that do not grow fast. And value investors love looking at companies on a price to earnings (P/E) basis, meaning how many dollars you’re going to pay for every $1 in earnings. They want to understand how much cash that company can make today, and they like high dividend-yielding companies as well. So, value investors love cash flow, so they love value companies based on Discount Cash Flow (DCF). That is why we chose DCF as a valuation method and P/E.
Growth investors have preferences for stocks that are growing quickly. They like to buy stuff that is expensive but grows very quickly. And the reason it’s expensive is because those companies are focused on growing revenue as fast as possible. Growth investors also like looking at price to earnings. They like to invest in companies with a higher price to earnings ratio, which is growing fast. Therefore, what they do is take the price divided by earnings and growth. That’s called the PEG ratio. Growth investors like cash flow a little bit, but they want the company to grow faster. Price to sales (revenue) is mainly for growth investors as well, because they like investing in companies that aren’t too profitable yet, but they’re growing really fast. For this reason, we choose to use P/R and P/E for valuation.
Part 2: key concept of valuation forecasting. Part 3: Results of Forecasting.
Key Concept of Valuation Forecasting
Time series Data Generation
We got data from the API with one value per year, so we made the assumption that between two years, valuation variation can be spited and generated in the form of a time series with random values between the previous year and the current year if the current year has at least one previous year of data. This time series data can be modeled by the expression:
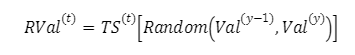
Where: RVal is random generated value of the valuation method (DCF, P/E, P/S) for one ticker, t is the time series period target weekly or daily, y is the year period given by the API, TS is the time series generator
The following figure shows and example of data generated for Apple Inc (AAPL).

Figure 1: Time Series generated P/E
We generate time series data because we need more data to use a prediction algorithm with just 5 values. The prediction will be highly biased. This time series generation also applies to P/S and DCF for all S&P 500 tickers.
Autoregressive Integrated Moving Average Model (ARIMA)
The ARIMA model is a family of statistical models for the study and estimation of data from time series. It specifically provides a set of standard structures for time series data and, as such, provides a simple yet powerful method for skillful forecasts of time series. ARIMA is a synonym for the Autoregressive Integrated Moving Average. It is a generalisation of the more basic autoregressive moving average and incorporates the convergence notion [1, 2].
Prophet Tool
The forecasting tool Prophet, launched by Facebook in 2017 [3], is designed to analyse time series that show patterns on different time scales, such as annual, monthly, and regular. It also has advanced capabilities to model holiday effects on a time-series and to incorporate custom change points. So, we use Prophet to get a sample going and up.
The Prophet method is, at its heart, a type of additive regression with four main components: a pattern of linear or logistic growth curve. Prophet detects pattern changes automatically by selecting change points from the data. It is a seasonal variable that uses the Fourier series annually, a seasonal weekly portion that uses dummy variables, and a user-furnished list of appropriate vacations. We will compare ARIMA and Prophet and select the most accurate tool for our study case.
Modeling the error formula between forecasting methods
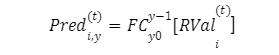
We use Rval to generate forecasts for the target year by using a forecasting method. In this study, the forecasting methods were Prophet and ARIMA, so the prediction can be expressed as follows with the equation (1).
 (2)
(2)
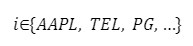
Where Pred is the time series of predicted values from the initial year y0 to the last year before the study year target of prediction y. And i is the ticker iteration in the dataset, for example.
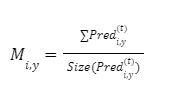
In this study, FC is the forecasting method modelled as a forecasting operator that predicts from y0 to y-1. It is Prophet and ARIMA. The mean value of a prediction time series for a ticker i is expressed as follows:
 (3)
(3)
The percent error is expressed as an absolute change between the given yearly valuation value and Valy,i
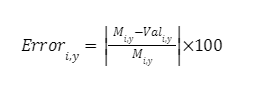 (4)
(4)
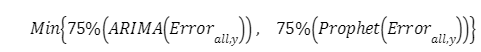
Modeling the selection criteria
For our dataset, we randomly picked a sample of 21 tickers from all sectors. For each methodology (P/E, P/S, DCF), the error is the dispersion around the given real value, so the smaller it is, the better it is. The selecting criteria we propose when comparing the two methodologies is to compare the statistical quartile with 75% of all compounded errors for the studied dataset. Thus, the minimum between the two is the selected methodology right for this problem. It is expressed as follows:
 (5)
(5)
The 75% minimum criteria is motivated by the fact that the majority has to be minimised in comparison to the other methods, so if there are some outliers, it can mislead the result when we take the mean criteria. Thus, we guarantee at least 75% of elements are minimized.

Results of Forecasting
The goal of this part is to present, interpret and validate the computational results obtained base in the previously analysis part.
Valuation Results Analysis
Prediction of valuation are performed with various ways by financial analysts so we propose here in this study to simulate two predictive mathematical model and compare results. This is a research study on ARIMA and Prophet in their capability to predict valuations.
Objectives
- Use ARIMA and Prophet prediction tools to simulate a prediction of PE, PS and DCF valuation.
- Calculate the errors between the predicted data and the real data dot each Method on each valuation.
- Compare results of ARIMA vs Prophet
Predictions view for one year
Predictions have been done for all S&P 500 data companies we base our study on. However, for sample and space reason we present only results for one ticker as sample for all three valuation methods. The figures below show the prediction for Prophet over Generated values.
- Predictions with Prophet

Figure 2: Prophet P/E prediction daily time series 2018 for TE Connectivity Ltd (TEL)
Figure 3: Prophet P/S prediction daily time series 2018 for TE Connectivity Ltd (TEL)


Figure 4: Prophet DCF prediction daily time series 2018 for TE Connectivity Ltd (TEL)
The Prophet outputs the historic data and the predicted data in the same data frame, so we can plot all of them together easily. The predicted data is done on a daily basis. At this step, we just plot the forecasted value for one year.
- Predictions with ARIMA
ARIMA tool output plot the selected predicted range period and the generated time series data is a weekly data like the generated historical data.

Figure 5: ARIMA P/E prediction daily time series 2018 for TE Connectivity Ltd (TEL)

Figure 6: ARIMA P/S prediction daily time series 2018 for TE Connectivity Ltd (TEL)

Figure 7: ARIMA DCF prediction daily time series 2018 for TE Connectivity Ltd (TEL)
The figures above show the predictions and values given by both methods, Prophet and ARIMA, to forecast one-year daily values. Visually, the prediction algorithms are not far from the observed data, which appears to be reliable tools for analysis. The next stage is the evaluation results of the mean errors to compare these two methods and select the one with the minimum mean error.
Valuations Errors results
With a sample dataset Errors for all the valuation method are calculated and can be visualize in the next Histogram figures by forecasting tool Prophet and ARIMA.

- Simulation Errors with Prophet
Figure 8: Histogram Percentage errors with Prophet for P/E, P/S, DCF
The statistical results of this simulation are below:
Table 1: Statistic results of Prophet Simulation of three valuations methods
| Mean Error% P/E | Mean Error% P/S | Mean Error% DCF | |
| count | 21 | 21 | 21 |
| mean | 16.91 | 10.11 | 9.51 |
| std | 11.74 | 8.95 | 7.75 |
| min | 1.44 | 0.71 | 1.62 |
| 25% | 10.20 | 3.70 | 5.31 |
| 50% | 13.92 | 7.45 | 8.02 |
| 75% | 24.63 | 14.63 | 10.71 |
| max | 46.20 | 36.42 | 31.03 |
For a dataset on 21 companies, for all valuation methods, the mean is less than 17%, so we have at least 83% accuracy of prediction by Prophet, which is a good performance for this problem. Also, for P/E, the 75% quartile can be predicted with at least 75% accuracy. With the other methods, P/S and DCF, 75% quartile of a company’s valuation can be predicted with more than 85% accuracy, which is a very good performance. The min errors are at least 98% accuracy, which is very good and shows that we do not have divergence behavior, as well as the max errors are not more than 100%, so the Prophet method alone appears to be a reliable tool.
- Simulation Errors with ARIMA

Figure 9: Histogram Percentage errors with ARIMA for P/E, P/S, DCF
The statistical results of this simulation are below:
Table 2: Statistic results of Prophet Simulation of three valuations methods
| Mean Error% P/E | Mean Error% P/S | Mean Error% DCF | |
| count | 21 | 21 | 21 |
| mean | 13.30 | 10.71 | 11.10 |
| std | 10.38 | 9.86 | 9.47 |
| min | 0.64 | 0.08 | 0.06 |
| 25% | 5.43 | 3.37 | 4.11 |
| 50% | 10.05 | 8.05 | 8.70 |
| 75% | 18.67 | 11.94 | 16.07 |
| max | 38.20 | 32.99 | 34.49 |
For a dataset on 21 companies, for all valuation methods, the mean is less than 14%, so in the mean we have at least 86% accuracy of prediction by ARIMA, which is a good performance for this problem. Also, for P/E, the 75% quartile can be predicted with at least 81% accuracy. The other methods, P/S and DCF, predict the 75% quartile of companies’ valuations with more than 86% accuracy, which is a very good performance. The min errors are at least 99% accuracy, which is very good and shows that we do not have divergence behavior, as well as the max errors are not more than 100%, so the ARIMA method alone appears to be a reliable tool.
- Comparing Errors with ARIMA and Prophet
Table 3: Comparing Prophet and ARIMA 75% results
| Mean Error% P/EMean Error% P/SMean Error% DCFARIMA 75%18.6711.9416.07Prophet 75%24.6314.6310.71 |
In general, ARIMA and Prophet for this dataset give relatively closed results, so ARIMA is slightly better than Prophet, but the difference of 6% for P/E and 3% for P/S is still low, so it can change according to the dataset. For DCF prediction, Prophet gave slightly better than ARIMA, with a difference of 6%. The results obtained show that both forecasting methodologies perform well and can be reliable for investors. However, based on these results, we conclude that value investors should select the Prophet forecasting methodology because it performs better on DCF and growth investors should select the ARIMA because it performed well on P/S.
Conclusion
In this paper, we performed a valuation forecast using two different methods: ARIMA and Prophet. The data used was historical financial data, given quarterly, hence not enough to perform a forecast on that. However, they used a generation tool to randomly generate data to fill the big period and have a daily timeframe. The results of the comparison between the error between the predicted values and the generated values on the real data are shown. For P/S and P/E, ARIMA showed better results, with an 80% chance of good production. Prophet, on the other hand, had a better prediction for DCF, with only about a 11% error in prediction. This study finally showed us that it is possible to use a mathematical tool for the prediction of valuation, which is a very critical concern for financial analysts.
Author: William Tchoudi
Bibliography
[1] Franses, Philip Hans, et al. Time Series Models for Business and Economic Forecasting. Cambridge University Press, 2014.
[2] Chacko, George, and Carolyn L. Evans. Valuation. Pearson Education, 2014.
[3] Prophete: https://research.fb.com/blog/2017/02/prophet-forecasting-at-scale/
 New Horizons in Education and Personal Development
LIGS University and ICAN Open Doors to Long-Term Success In today's dynamic…
 Relationship Management in the Oil and Gas Organizations: The Niger Delta Experience
No organization anywhere in the world could derive sustainable development without imbibing…
 How to write in academic style | APA 101
Writing an academic paper can be rough. There are so many rules…