

Investigation of factors that contribute to satisfaction among students in Kazakhstan Universities
The title of the research involves the investigation of the factors that are capable of bringing about a greater level of satisfaction among students in Kazakhstan universities. The researcher had the intention of establishing and understanding the relationship between the independent variables of the research and these were chosen to be university academic staff, university location, technology utilisation, assessment and feedback styles, and university reputation, and the dependent variable of student satisfaction. The researcher wanted to investigate how these independent variables affected the dependent variable. The research problem established in this analysis was that certain institutions of higher learning in Kazakhstan are experiencing low registration rates and also high student turnover. This is a problem making these institutions and the industry become very uncompetitive and therefore, there is a need for research to be done to identify the various factors that can help these institutions of higher learning to attract and retain students more efficiently, by providing them with better satisfaction. A quantitative research design is used in this analysis with the help of a questionnaire to collect quantitative data. A sample of 250 respondents will be created using the convenient sampling technique and the responses will be collected and analysed using SPSS statistical analysis. The main findings from the data analysis process showed reliability of the research instrument, it showed normality of the data, it showed agreement among the survey respondents with the constructs in the questionnaire scales and, it showed a positive correlation between the independent variables and the dependent variable. It also highlighted statistical significance between the dependent variables and the dependent variable via the test outcome of the multiple regression analysis. Based on all of this, the hypotheses testing was conducted and it is found that all of the research hypotheses that were created by the researcher are supported.
Research Questions
- Does the quality of university academic staff affect the satisfaction of students in Kazakhstan universities?
- Does the university location affect the satisfaction of students in Kazakhstan universities?
- Does technology utilisation affect the satisfaction of students in Kazakhstan universities?
- Do assessment and feedback styles affect the satisfaction of students in Kazakhstan universities?
- Does university reputation affect the satisfaction of students in Kazakhstan universities?
Research Objectives
- To examine the role of quality of university academic staff in influencing the satisfaction of students in Kazakhstan universities
- To examine the role of university location in influencing the satisfaction of students in Kazakhstan universities
- To examine the role of technology utilisation in influencing the satisfaction of students in Kazakhstan universities
- To examine the role of assessment and feedback styles in influencing the satisfaction of students in Kazakhstan universities
- To examine the role of university reputation in influencing the satisfaction of students in Kazakhstan universities
Research Problems
In the past, numerous studies were carried out about the satisfaction of students and the factors that affect it when it comes to choosing tertiary education institutions Awais et al., (2019), Riva, Tunna & Rubel, (2019), Hornby, (2018), Weerasinghe & Fernando, (2017). Despite the wealth of studies done in the past concerning these factors, nevertheless, the studies done about tertiary institutions in Kazakhstan are very few. This will be one of the very few research papers done about the factors that affect the satisfaction of tertiary students, both local and international, in Kazakhstan. More importantly, an even less the number of studies has taken into consideration the various factors that will be included in this present study, when it comes to making a valuation of the satisfaction of the student (Awais, Rehman, Ishfaq, & Naseem, 2019). Many institutions of higher learning in Kazakhstan are unable to attract and retain students due to the inability of these institutions to provide their students with a high level the satisfaction (Riva, Tunna, & Rubel, 2019). This is a problem that needs to be addressed and it is the intention of this researcher to address such a problem.
Review of Related Literature
The concept of satisfaction is a very widely researched concept and the ability of an organisation to provide high satisfaction to their customers is very essential because satisfied customers will be attracted to the brand of the organisation that is providing them with satisfaction and not only to be loyal customers, but also to recommend it to others as well (Ali, Zhou, Hussain, Nair, & Ragavan, 2016). The same applies to students of universities who will show better loyalty to any university that provides them with better satisfaction (Braun & Zolfagharian, 2016). Students are customers of universities and universities compete for business by attracting students and therefore, it is essential to get students to study at the university so that they can become more competitive, earn more profits and acquire a competitive advantage over other universities (Hanssen & Solvoll, 2015).
The ability of these universities to provide satisfaction to the students is a matter of great concern, especially from a Kazakhstan perspective. The fact is that universities that are capable of providing students satisfaction will enjoy better student loyalty and better word of mouth about the university brand (Weerasinghe & Fernando, Students’ satisfaction in Higher Education: Literature review., 2017). Research has shown that the better the quality of services provided by the University, the better the satisfaction of the student (Thetsane, Mokhethi, & Bukenya, 2019). The satisfied students will provide positive word of mouth about the university, thus providing the universities with free marketing.
Academic Staff Quality
The quality of academic staff is regarded as having a strong effect on the satisfaction of students at universities (Kara, Tanui, & Kalai, 2016). Many researchers found that when it comes to staff working at the University, the qualifications possessed by them as well as the skills associated with the teaching do affect the satisfaction of students in a positive way (Weerasinghe & Fernando, 2018). Many universities across the world are starting to embrace new and improved teaching methods as a means of attracting students to satisfy their quest for quality education (Zeglat, Shrafat, & Al-Smadi, 2016). Universities that are unable to provide the students with such advanced quality teaching and learning will be left behind (Chung, Jung, & Lee, 2017).
The quality of teaching is regarded as being very essential for the overall image quality of the University and to develop a higher level of satisfaction among students for the long-term (Weerasinghe & Dedunu, University staff, image and students’ satisfaction in selected state universities., 2017). In essence, the performance of the academic staff of the University, whether they are teachers or those involved in administration, must be defined very well and they must be able to execute the tasks and responsibilities with a greater level of efficacy possible (Chung, Jung, & Lee, 2017). Based on this, the hypothesis below is provided
H1: There is a positive association between the quality of university academic staff and satisfaction of students in Kazakhstan universities
Location of University
Location of the university is a factor that is usually characterised based on factors like the availability of accommodation, the ability of students to ensure efficient transportation to and from the university as well as the presence of basic amenities in the location surrounding the University (Ali, Zhou, Hussain, Nair, & Ragavan, 2016). Universities that are located in secure locations tend to bring about better satisfaction among the students (Mukhtar, Ahmed, Anwar, & Baloch, 2015). On the other hand, a university that is located in unsafe locations may not be welcomed by students (Martirosyan, 2015). Generally, the students are likely to show an affinity to the University that is located in an area that is regarded by them as being convenient, safe, and which has a very positive community vibe (Shahijan, Rezaei, & Amin, 2016). Based on this literature, the researcher proposes the following hypothesis:
H2: There is a positive association between university location and satisfaction of students in Kazakhstan universities
Technology Utilisation
The present-day educational environment is said to be supported by very advanced technologies (Riva, Tunna, & Rubel, 2019). An increasing number of universities have started to embrace education technologies that have to enhance the process of teaching and learning for the benefit of the students (Mokhethi, Malunga, & Thetsane, 2019). In other words, education-based technologies have paved the way for faster and more efficient delivery of teaching materials to students and technology is also enhancing the ability of the students to understand the materials being taught (Hornby, 2018). In other words, technology has enhanced the speed and efficiency of the learning process for the benefit of the teachers and students as well. Various technology-based tools have improved the skills of students as well as the procedure of delivering lectures to the students (Weerasinghe & Fernando, 2018). Many universities have started to embrace the concept of e-learning and this has resulted in better convenience to the student. It is said that e-learning is a concept that has a very important and prominent role in paving the way for the ability of these universities to attract students (Thetsane, Mokhethi, & Bukenya, 2019). In these present times, students who have very high expectations from the university and universities that are not technologically equipped and advanced will be left behind and be incapable of attracting students (Li & Carroll, 2017 ). On the other hand, universities that are very technologically advanced and provide students with technological tools and applications that facilitate the learning process will result in the students being attracted to study at that particular university because they know they are being given quality education (Kara, Tanui, & Kalai, 2016). Based on this, the hypothesis below is created:
H3: There is a positive association between technology utilisation and satisfaction of students in Kazakhstan universities
Assessment and Feedback Styles
Students from different cultures as well as nationalities tend to have different styles of making assessments and interpreting feedback that they obtain from their lecturers as part of the process of learning (Weerasinghe & Fernando, 2018). As the difference between the home country and the host country of the student starts to increase, the difference in learning and assessment styles also starts to become quite difficult (Thetsane, Mokhethi, & Bukenya, 2019). It is established that the kind of results that students obtain from assessment and feedback by the lecturers can affect their satisfaction (Ali, Zhou, Hussain, Nair, & Ragavan, 2016). Students that acquire very negative assessment and feedback from the lecturers tend to become very dissatisfied with the university and might even leave the University eventually (Kara, Tanui, & Kalai, 2016).
On the other hand, students who get positive assessment and feedback based on their competence and abilities will usually be satisfied with the university (Ali, Zhou, Hussain, Nair, & Ragavan, 2016). Mukhtar, et al., (2015) has shown that universities that provide very high quality and equitable assessment and feedback to students are the ones that are likely to make these students become very satisfied and to recommend the university to others, as opposed to those who receive low-quality assessment and feedback about their performance (Mokhethi, Malunga, & Thetsane, 2019). In essence, the assessment and also feedback provided by lecturers play a very essential role in generating satisfaction among the students, and students that are assessed and provided with feedback unjustly and unfairly would usually have better satisfaction and are likely to show loyalty to that university and recommend it to others as well (Riva, Tunna, & Rubel, 2019). Researchers have found a positive correlation between the quality of assessment and feedback by lecturers and the satisfaction of students (Shahijan, Rezaei, & Amin, 2016), and as such, the following hypothesis is analysed.
H4: There is a positive association between assessment and feedback styles and satisfaction of students in Kazakhstan universities
University Reputation
The reputation and image of the University is also a factor that many researchers have pointed out as having a significant effect on the satisfaction of students (Hayat, 2019). These researchers claim that a university that has a very positive and reputable image does have a very strong effect on the satisfaction of the students and thereby their loyalty (Riva, Tunna, & Rubel, 2019). The reputation of the university is a factor to which many students give a lot of importance and are likely to choose universities that have a very positive reputation (Braun & Zolfagharian, 2016). On the other hand, universities that have a very bad reputation are likely to bring about a lot of dissatisfaction on part of the students and the students are likely to leave the university and not recommend it to others (Weerasinghe & Fernando, 2018).
Generally, universities that have a positive image will provide better satisfaction to their students because the students will be provided with better quality teaching and learning from a university having a high reputation (Ali, Zhou, Hussain, Nair, & Ragavan, 2016). On the other hand, universities that have a low reputation will invariably provide low-quality education to the students and provide dissatisfaction. Braun & Zolfagharian, (2016) has found that the image of the university does have a direct and effective influence on the satisfaction and dissatisfaction of the students. The ability of the university to provide satisfaction to the students depends on their ability to project a very sound and positive image of themselves in the eyes of the students (Hanssen & Solvoll, 2015). Based on this, the hypothesis below is provided:
H5: There is a positive association between university reputation and satisfaction of students in Kazakhstan universities
Conceptual Framework
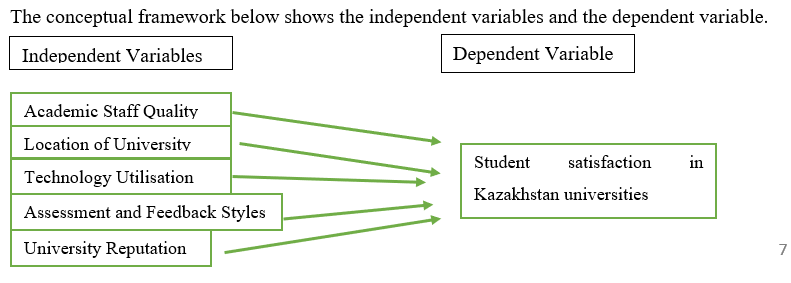
The research hypotheses premised on the conceptual framework are described below:
H1: There is a positive association between the quality of university academic staff and satisfaction of students in Kazakhstan universities
H2: There is a positive association between university location and satisfaction of students in Kazakhstan universities
H3: There is a positive association between technology utilisation and satisfaction of students in Kazakhstan universities
H4: There is a positive association between assessment and feedback styles and satisfaction of students in Kazakhstan universities
H5: There is a positive association between university reputation and satisfaction of students in Kazakhstan universities
Research Methodology
To perform this research successfully, the researcher understands that it is important to use the appropriate research methodology for the research. This discussion starts with an outline of the type of research design that the researcher adopted. Because the researcher intends to test the research hypothesis using quantitative data, a quantitative research design was adopted by the researcher. This is a research design that is ideal for such research where the researcher aims to gather a large number of responses from a wide population and to analyse them to identify trends and correlations in the data (Carlson & Winquist, 2014). The advantages of this research methodology are that it facilitates the process of data collection and makes the overall process fast and efficient (Creswell & Creswell, 2017 ).
The first part of the research methodology that will be discussed here involves the research instrumentation. For this research, a questionnaire was developed and designed, and which is ultimately disseminated to the target population. Such a research questionnaire is aimed at collecting important data from the respondents to answer the questionnaire.
The next part of the research methodology discussion involves discussing the research population that the researcher has chosen. In this case, the research population consists of students studying in Kazakhstan.
When it comes to the research sampling procedure, the researcher does not have access to the sampling frame, meaning that the researcher does not have a list of names of students studying in universities in Kazakhstan and as a result, the researcher was compelled to use a nonprobability sampling technique. This sampling technique involves choosing participants not random. Many different kinds of nonprobability sampling techniques can be used and the researcher has chosen to use the convenience sampling technique (Carlson & Winquist, 2014). This is a very ideal method of sample creation when it comes to making a sample for an online survey, like the one that the researcher did (Creswell & Creswell, 2017 ).
The next part of the research methodology discussion concerns the data analysis process. Because of the quantitative design adopted, the researcher will use a quantitative research methodology analysis technique to analyse the data. The quantitative analysis process was made possible with the use of statistical analysis software like SPSS. Many SPSS tests were conducted in this study and these included the frequencies tests to test the demographic countries of the respondents, the descriptive mean and standard deviation test in order to test the agreement levels of the respondents with the construct measures, there was a normality test conducted to determine the normality of data from the population, there was a reliability test conducted to determine whether or not the scales of the questionnaire were reliable and internally consistent and there were also parametric tests carried out (Carlson & Winquist, 2014). The parametric tests carried out here including the Pearson’s correlation coefficient test to determine the correlations between the independent variables and the dependent variable, whereas the multiple regression test was done in order to show the fit of the data with the regression model and also to show the significance between the variables (Chawla & Sodhi, 2011). After obtaining the significance values, hypotheses tests will be conducted to show whether or not the hypothesis that the researcher created in the literature review is supported (Creswell & Creswell, 2017 ).
Discussion of Findings
Frequencies Statistics Analysis
Based on the analysis, it is found that respondents who identify as male are 44.8%, while females are 55.2%. The obvious fact is that females make up the majority of the participants in this research project.
About the age category analysis, observed here is that 16.4% between 18 to 20, a total of 23.2% are 21 to 30 and 25.2% are 31 to 40. Also found is that the respondents between 41 to 50 are 30.4% and those who are 51 and above are 4.8%. The analysis shows that a majority of the participants of this research are between 31 to 50 years of age.
When it comes to analysing the student’s nationality, the research findings show that students who identify as Kazakh are 50.4% and foreigners are 49.6%. The majority of the students taking part are from Kazakhstan but a sizeable number of foreigners have also taken part in this study.
The monthly income analysis shows that participants that earn between USD 1500 – USD 2500 are 18.4%, those earning between USD 2500 – USD 3500 are 19.6%, participants who earn USD 3500 – USD 4500 are 20.8%, respondents who earn USD 4500 – USD 5500 are 27.6%, those earning USD 5500 – USD 6500 are 4.0% and those earning above USD 6500 are 9.6%. The statistics show that the student studying at tertiary institutions of learning in Kazakhstan have an income and perhaps they are working part-time.
The reliability statistics are meant to show how reliable the measures of the questionnaire are. This is a test of internal consistency designed to show whether the measures of the questionnaire have the required internal consistency. It is commonly agreed that the alpha needs to be larger than 0.7 for there to be the reliability of the measures. In this case, all the alphas for every one of the measures are larger than 0.7. It means that the test of reliability is passed for all of the measures and therefore, the questionnaire is held to be reliable.
Normality Histogram Analysis
A normality test was carried out and the results of the histogram that is provided below are now interpreted.
According to the results, the researcher can decipher that this histogram does provide a bell-shaped curve. The presence of a bell-shaped curve will signify that normality is present in the data that is acquired from the population. This means that the test of normality is successfully achieved in this research.
Descriptive Mean and Standard Deviation
A descriptive mean and standard deviation analysis are given below for every variable of the research.
- Concerning the variable of student satisfaction, the findings prove that the majority agree that they are likely to study at a university if it provides them with satisfaction (as established by the mean of 4.64 and the standard deviation of 0.529) and it is found that they are unlikely to study at university that does not satisfy their needs (as established by the mean of 4.63 and the standard deviation of 0.531). Many also agree that as a student, they believe that a university must have the priority of providing them with satisfaction (as established by the mean of 4.64 and the standard deviation of 0.529) and that they are likely to continue to study at the University if they are satisfied with the experience of the University (as established by the mean of 4.63 and the standard deviation of 0.531). Most of the participants also believe that they are likely to recommend others to join the University if they are satisfied with the services provided (as established by the mean of 4.62 and the standard deviation of 0.533).
- About the variable of university academic staff, it is found that a lot of the participants believe that the academics staff of the University that are skilled and knowledgeable make them satisfied with the University (as established by the mean of 4.71 and the standard deviation of 0.408) and also that academics staff that are inefficient and not very knowledgeable will make them dissatisfied (as established by the mean of 4.71 and the standard deviation of 0.399). Next, the majority expect the lecturers at the University to be very efficient and effective teaching (as established by the mean of 4.69 and the standard deviation of 0.464) and also that university lecturers must have the required knowledge and skills to teach students in a way that they can satisfy their needs (as established by the mean of 4.75 and the standard deviation of 0.433). Another observation is that those participants are likely to study at a university that has academic staff that is very qualified and experienced (as established by the mean of 4.69 and the standard deviation of 0.464).
- In analysing the responses concerning the news location variable, the researcher finds that a huge number of respondents attach importance to the location of the University they study at (as established by the mean of 4.69 and the standard deviation of 0.464) and that the university located in an inconvenient area will reduce their satisfaction levels (as established by the mean of 4.75 and the standard deviation of 0.433). Also found from the analysis is that the majority are satisfied if the University is located in a decent area and has a commendable level of security (as established by the mean of 4.69 and the standard deviation of 0.464) and they are satisfied if the University is located at a place where they can find food and easily (as established by the mean of 4.75 and the standard deviation of 0.433). The researcher also observes that many participants in this survey have the opinion that university campuses that are located near to their accommodation will enhance their satisfaction level (as established by the mean of 4.69 and the standard deviation of 0.464).
- An analysis of the responses by the participants concerning the technology utilisation variable shows that a majority of participants agree with these constructs in the scale. This means that most of the participants believe that a university that is technologically efficient and advanced will make me more satisfied (as established by the mean of 4.69 and the standard deviation of 0.464) and that a university that is technologically inefficient and not advanced will make them dissatisfied (as established by the mean of 4.75 and the standard deviation of 0.433). The researcher also finds that a large number believe that universities that can use technology intelligently will enhance the ability to teach them efficiently and thus improve the satisfaction levels (as established by the mean of 4.69 and the standard deviation of 0.464) and a university that provides them with the ability to access advanced digital technology to assist their learning will make them more satisfied (as established by the mean of 4.69 and the standard deviation of 0.464). Besides, the researcher observes that most of the survey participants agree that a university that has a very advanced and technologically equipped web portal to facilitate their academics-related activities will make them more satisfied (as established by the mean of 4.68 and the standard deviation of 0.467).
- About the scale on assessment feedback styles, the researcher finds that a large number of the survey respondents provide views that indicate that they attach a lot of importance to the quality of the assessment and feedback of their lecturers (as established by the mean of 4.62 and the standard deviation of 0.504) and lecturer assessments that are fair and equitable would satisfy them (as established by the mean of 4.59 and the standard deviation of 0.508). Apart from that, it is found that the majority of the participants emphasise that lecturer assessments that are unfair and not equitable make them dissatisfied (as established by the mean of 4.69 and the standard deviation of 0.481), the feedback provided by comprehensive lecturers and value-adding would satisfy them (as established by the mean of 4.66 and the standard deviation of 0.490) and lecturer feedback that is not comprehensive and bias dissatisfies them (as established by the mean of 4.66 and the standard deviation of 0.493).
- When it comes to the variable of university reputation, the findings show that most of those taking part in the survey give a lot of importance to the reputation of the university they study at (as established by the mean of 4.63 and the standard deviation of 0.5312), they agree that a university having a positive reputation makes them satisfied (as established by the mean of 4.62 and the standard deviation of 0.533) and they believe that a university having a bad reputation would make them dissatisfied (as established by the mean of 4.69 and the standard deviation of 0.464). Also, they strongly believe that a university that has a good reputation would make them recommend it to others (as established by the mean of 4.75 and the standard deviation of 0.433) and they are likely to study for the long term at a university that has a good reputation (as established by the mean of 4.69 and the standard deviation of 0.464).
Pearson’s Correlation Statistics
A discussion is provided now about the correlation statistics obtained.
The first relationship to be analysed here is that between the independent variable of university academic staff and the dependent variable of student satisfaction. The correlation coefficient from this analysis is 0.649 and this shows a moderate strength linear correlation between both these variables. The implication that can be deciphered here from the analysis is that university academic staff does affect student satisfaction and the better the quality of the university academic staff, the better the satisfaction of the student will be.
The second relationship to be analysed here is that between the independent variable of university location and the dependent variable of student satisfaction. The correlation coefficient that is acquired from this analysis is once again is 0.649. This statistic shows a moderately strong linear correlation that is present between both these variables. The implication from the analysis is that university location does affect student satisfaction and the better the location of the university, the better the satisfaction of the student will be.
The third relationship to be analysed here is that between the independent variable of technology utilisation and the dependent variable of student satisfaction. The correlation coefficient is 0.723. This statistic provides a strong linear correlation between both these variables. The implication that is observed is that technology utilisation does affect student satisfaction and the more effective the utilisation of technology by the university, the better the satisfaction of the student will be.
The following relationship to be analysed here is that between the independent variable of assessment and feedback style and the dependent variable of student satisfaction. The correlation coefficient is 0.606. This statistic provides a moderate linear correlation between both these variables. The implication is that assessment and feedback style does affect student satisfaction and the more effective the better the assessment and feedback style, the better the satisfaction of the student will be.
The next relationship analysed here is that between the independent variable of university reputation and the dependent variable of student satisfaction. The correlation coefficient is 0.847. This statistic provides a strong linear correlation between both these variables. The implication that is observed is that university reputation does affect student satisfaction and the better the reputation of the university, the better the satisfaction of the student will be.
Multiple Regression Analysis
Table 1.1: Model Summary Analysis
| Model Summary | |||||
| Model | R | R Square | Adjusted R Square | Std. Error of the Estimate | Durbin-Watson |
| 1 | .942a | .887 | .885 | .154 | 1.837 |
| a. Predictors: (Constant), IVE, IVD, IVA, IVC, IVB | |||||
| b. Dependent Variable: DV | |||||
The first analysis will be carried out on the multiple correlation coefficient that is represented by the R column. The value is 0.942 shows a satisfactory prediction level. The next analysis will be about the coefficient of determination that is represented by the R square column. In this case, the value of 0.887 means that the independent variables of this research explain 88.7% variability of the student satisfaction variable.
Table 1.2: ANOVA Analysis
| ANOVAa | ||||||
| Model | Sum of Squares | df | Mean Square | F | Sig. | |
| 1 | Regression | 45.392 | 5 | 9.078 | 384.198 | .000b |
| Residual | 5.766 | 244 | .024 | |||
| Total | 51.158 | 249 | ||||
| a. Dependent Variable: DV | ||||||
| b. Predictors: (Constant), IVE, IVD, IVA, IVC, IVB | ||||||
Based on the F ratio calculation which is F (5,244 = 384.198, p <0.0005), it would be observed that the regression model is good fit for the data.
Table 1.3: Coefficients Analysis
| Coefficientsa | ||||||
| Model | Unstandardized Coefficients | Standardized Coefficients | t | Sig. | ||
| B | Std. Error | Beta | ||||
| 1 | (Constant) | .030 | .133 | .227 | .821 | |
| University Academic Staff | .630 | .216 | .564 | 2.919 | .004 | |
| University Location | -2.507 | .240 | -2.205 | -10.427 | .000 | |
| Technology Utilisation | 1.101 | .104 | .955 | 10.635 | .000 | |
| Assessment And Feedback Styles | .171 | .037 | .141 | 4.675 | .000 | |
| University Reputation | 1.601 | .069 | 1.389 | 23.291 | .000 | |
| a. Dependent Variable: DV | ||||||
The coefficient analysis here is meant to show the statistical significance between the variables. Generally speaking, if the Sig value is lower than 0.05, the variables will be significant. In this case, all the Sig values for all the five independent variables are below 0.05 and this means there is statistical significance between every one of the independent variables that consist of University Academic Staff, University Location, Technology Utilisation, Assessment, and Feedback Styles and University Reputation, and the dependent variable which is student satisfaction.
Table 1.4: Hypothesis Testing Results
| Hypotheses | Significance Value | Decision |
| H1: There is a positive association between quality of university academic staff and satisfaction of students in Kazakhstan universities | 0.000 | Accepted |
| H2: There is a positive association between university location and satisfaction of students in Kazakhstan universities | 0.000 | Accepted |
| H3: There is a positive association between technology utilisation and satisfaction of students in Kazakhstan universities | 0.000 | Accepted |
| H4: There is a positive association between assessment and feedback styles and satisfaction of students in Kazakhstan universities | 0.000 | Accepted |
| H5: There is a positive association between university reputation and satisfaction of students in Kazakhstan universities |
From the above table, all the research hypotheses are supported thus enabling the researcher to prove that the satisfaction of students in Kazakhstan universities can be improved by a better quality of university academic staff, better university location, better technology utilisation, better assessment and feedback styles, and better university reputation.
Conclusion and Recommendations
The ultimate aim of this empirical research was to establish the nature of the relationship between the selected independent variables consisting of university academic staff, university location, technology utilisation, assessment and feedback styles, and university reputation, and the dependent variable of student satisfaction. The research identified a research problem involving certain institutions of higher learning in Kazakhstan having low registration rates and also high student turnover and therefore set out to do this research to identify what factors can help these institutions of higher learning to attract students more efficiently and provide them with better satisfaction and thus making them more loyal to that University.
This research was done using a quantitative research design to highlight trends within quantitative data about the relationship between the independent variables and the dependent variable. 250 responses were collected and the responses were analysed. The outcome of the analysis provided many findings that helped the researcher understand better the relationships between the independent variable chosen and the dependent variable. In essence, the researcher managed to uncover important factors which can affect the satisfaction of students studying at institutions of higher learning in Kazakhstan. The researcher showed that the satisfaction of students in universities in Kazakhstan was affected by factors such as university academic staff, university location, technology utilisation, assessment, and feedback styles, and university reputation.
Therefore, what the researcher recommends is that universities in Kazakhstan make an effort to improve themselves so that they are able to attract students more efficiently and also result in the students showing better loyalty to the organisation. The recommendations that will be made include emphasising the importance of hiring and training university academics staff to become very competent and knowledgeable to enable them to provide superior learning experiences to the student. Besides that, the University must also ensure that its location is ideal, convenient, and safe for the students. Apart from that, the University must equip themselves with advanced technologies and be capable of using such technologies to facilitate and enhance the process of teaching and learning in the University for the benefit of the students. Apart from that, the teachers must also be trained to embrace assessment and feedback styles that are value-adding to the students. Besides, the University must also invest significant amounts of resources in enhancing the image and reputation so that they can project a very value-adding image of themselves in the eyes of the student. These recommendations will ensure that institutions of higher learning in Kazakhstan will be able to attract students more successfully and retain them as well.
Author: Ainur Zhamagatova
References
Ali, F., Zhou, Y., Hussain, K., Nair, P., & Ragavan, N. (2016). “Does higher education service quality effect student satisfaction, image, and loyalty”,. Quality Assurance in Education,, 24(1), 70 -94.
Awais, A., Rehman, R., Ishfaq, M., & Naseem, M. (2019). DETERMINANTS OF STUDENTS SATISFACTION IN PRIVATE UNIVERSITIES: A CASE OF PAKISTAN. MIER Journal of Educational Studies, Trends and Practices,, 9(1).
Braun, J., & Zolfagharian, M. (2016). Student Participation in Academic Advising: Propensity, Behavior, Attribution and Satisfaction. Research in Higher Education,, 57(8), 968-989.
Carlson, K., & Winquist, J. (2014). An Introduction to Statistics. . SAGE Publications.
Chawla, D., & Sodhi, N. (2011). “Research Methodology: Concepts and Cases” . Vikas Publishing House PVT Ltd.
Chung, H., Jung, S., & Lee, J. (2017). Socio-demographic factors affecting levels of cultural and non-cultural prejudice: comparing Korean, Chinese, and Japanese college students. Multicultural Education Review,, 9(1), 30-43.
Creswell, D., & Creswell, J. (2017 ). Research Design: Qualitative, Quantitative, and Mixed Methods Approaches . SAGE Publications, .
Daniel, D., Liben, G., & Adugna, A. (2017). Assessment of students’ satisfaction: A case study of Dire Dawa University, Ethiopia,. Journal of Education and Practice,, 8(4), 111-120.
Goertzen, M. (2017). Introduction to Quantitative Research and Data. Library Technology Reports, 53(4), 12–18.
Hanssen, T., & Solvoll, G. (2015). “The importance of university facilities for student satisfaction at a Norwegian university”,. Facilities,, 33(3\4), 744-759.
Hayat, A. (2019). Measurement of e-services quality: an empirical study of University of Bahrain. Education and Information Technologies, 24, 3.
Hornby, G. (2018). Eight key evidence-based teaching strategies for all levels of education. Australian Educational Leader,, 40(4), 28.
Islam, M., Gul, F., & Rahman, M. (2017). Student overall satisfaction with university services in Malaysia. International Journal For Research In Applied And Natural Science, 3(2), 01-08.
Kara, A., Tanui, E., & Kalai, J. (2016). Educational service quality and students’ satisfaction in public universities in Kenya. International Journal of Education and Social Sciences,, 3(10), 37-48.
Li, I., & Carroll, D. (2017 ). Factors Influencing University Student Satisfaction, Dropout and Academic Performance: An Australian Higher Education Equity Perspective. . National Centre for Student Equity in Higher Education (NCSEHE), Perth: Curtin University.
Martirosyan, N. (2015). “An examination of factors contributing to student satisfaction in Armenian higher education”,. International Journal of Educational Management,, 29(2), 177 -191.
Mokhethi, M., Malunga, M., & Thetsane, R. (2019). Service Quality, Students’ Satisfaction And Behavioural Intentions In Stem And Ic Higher. Education Institutions Review of Contemporary Business Research, 8(2), 1-11.
Mukhtar, U., Ahmed, U., Anwar, S., & Baloch, M. (2015). “Factors affecting the service quality of public and private sector universities comparatively: an empirical investigation”,. Journal of Arts, Science & Commerce,, 3(1), 132-142.
Riva, F., Tunna, N., & Rubel, M. (2019). Employee Quality Performance, Customer Orientation and Loyalty: Antecedent and Outcome of Customer Satisfaction. Asian Social Science,, 15(4).
Shahijan, M., Rezaei, S., & Amin, M. (2016). International Students’ Course Satisfaction and Continuance Behavioral Intention in Higher Education Setting: An Empirical Assessment in Malaysia. Asia Pacific Education Review,, 17(1), 41-62.
Thetsane, R., Mokhethi, M., & Bukenya, P. (2019). Students Choice of a university: Case of the National University of Lesotho (NUL). Journal of Education and Social Policy,, 6(2), 140-148.
Ullah, Z., & Ahmad, N. (2020). Critical Factors of Student Satisfaction in Private Universities of Pakistan. Journal of Xi’an University of Architecture & Technology, XII(VIII).
Weerasinghe, I., & Dedunu, H. (2017). University staff, image and students’ satisfaction in selected state universities. Journal of Business and Management,, 19(5), 34–37.
Weerasinghe, I., & Fernando, R. (2017). Students’ satisfaction in Higher Education: Literature review. American Journal of Educational Research,, 5(5), 533-539.
Weerasinghe, I., & Fernando, R. (2018). “Critical factors affecting students’ satisfaction with higher education in Sri Lanka”,. Quality Assurance in Education,, 26(1), 115-130.
Zeglat, D., Shrafat, F., & Al-Smadi, Z. (2016). The impact of the E-service quality of online databases on users’ behavioral intentions: A perspective of postgraduate students. International Review of Management and Marketing,, 6(1), 1-10.
 New Horizons in Education and Personal Development
LIGS University and ICAN Open Doors to Long-Term Success In today's dynamic…
 Relationship Management in the Oil and Gas Organizations: The Niger Delta Experience
No organization anywhere in the world could derive sustainable development without imbibing…
 How to write in academic style | APA 101
Writing an academic paper can be rough. There are so many rules…