Financial Matrix for Supply Chain Performance Measurement
Understanding the financial matrix for supply chain performance monitoring was the major goal of this study. Establish the key financial matrices used to assess supply chain performance, as well as the qualities of a successful supply chain performance measure, were the particular goals.
1.0 Introduction
Performance measurement is an important topic which should be considered in any supply chain (Rahiminezhad Galankashi and Helmi, 2016). Supply chain performance measurement is important as today’s competition is no more between companies (Sahay, 2003). In other ways, as market rivalry increases, supply chains are vying for customers' business and absorbing a larger share of the available demand (Thirumalai and Sinha, 2005). Consequently, rather than focusing on individual components, it is essential to optimize the efficiency of the entire supply chain (Behrouzi and Wong, 2013). Using proper metrics is required, according to the performance measurement concept, to evaluate performance (Galankashiet al., 2018a, b). In this context, it is crucial to conduct additional research on inventing, identifying, measuring, and implementing the right and suitable methods to analyze the performance of supply chains from a financial viewpoint (Ritchie and Kolodinsky, 2003). Although there are several financial performance criteria in supply chains that need to be looked into, prior research has mostly focused on cost (Lawton and Solomko, 2005). To put it another way, prior research on supply chain performance measurement has emphasized the significance of switching from financial to non-financial performance assessment of supply networks (Hernaus et al., 2012). However, these studies have not taken into account the precise financial performance management measures and how they differ. Additionally, past research indicates that even while the synchronization and optimizing of information and material flows has substantially improved in earlier literature (Lehmann, 2011), supply chain managers do not actually elaborate on money flows (Friemann et al., 2012). This is primarily because financial performance measurements have inherent complications (Lu and Shang, 2017). As a result, the finance matrix for supply chain performance measurement is evaluated in this study. The study answers the following research inquiries:
- What are the main financial matrices used to evaluate supply chain performance?
- What are the challenges encountered in using financial matrix to evaluate supply chain performance?
2.0 Literature review
This section of the study reviews materials in relations to the topic being studied.
2.1 Supply chain performance measures
Neely et al. (1995) defined performance measurement as "the process of assessing the efficiency and effectiveness of action." Effectiveness indicates how efficiently a firm's resources are used to reach a predetermined level of customer satisfaction, whereas efficiency measures how effectively a firm's resources are used to achieve a predetermined level of customer satisfaction. According to Neely et al. (Neely, 1998; Neely, 2005), you only have good background and understanding about something if you can quantify it and communicate it in numbers. Otherwise, your understanding of it is restricted and inadequate. Performance measurement, according to Bhagwat and Sharma (2007), refers to the feedback on operations that are focused toward customer satisfaction, strategic decisions, and objectives. They go on to say that performance measurement highlights the need for improvement in operational areas known as bottlenecks in performance measurements.
Supply Chain Management (SCM) is identified as a key pillar for competitive strategy enhancing productivity and profitability for the business. Most businesses have focused on many methods of measuring performance of the operations and its human resources in most cases neglecting the performance of the related supply chains and logistics. Pittiglio, Rabin, Todd, and McGrath, also known as PRTM, developed the first universal performance metrics used in supply chain performance measurement (Wong and Wong, 2008). In the last 20 years, there has been a significant growth in interest in performance assessment and management (Taticchi et al., 2010). Globalization, technology, and the growing need for environmental responsibility and sustainability are causing enterprises and individuals to alter their lifestyles, work, and play (Bititci et al., 2018). As a result, developing an efficient (efficiency is a measure of how effectively a firm's resources are used when offering a given level of customer satisfaction) strategy is crucial for a Supply chain performance measurement system (Neely et al., 2005). Monitoring and improving the performance of a supply chain, on the other hand, has become a more difficult process due to complicated SCM processes and interlinks both internal and external to the business (Cohen et al., 2017).
What should practitioners know about the measures they should use? When should you utilize it? How can I use appropriate measures to examine the supply chain's performance? The reason for this complication is that performance measurements vary by circumstance. The concept of a "good supply chain strategy" is impossible to generalize. The supply chain strategy (such as risk hedging, efficiency, responsiveness, and agility) and product features (functional vs. inventive) must be in sync. When it comes to analyzing supply chain strategy for diverse supply chain topologies (such as liner, network, and amorphous), the problem becomes even more challenging. Before a supply chain performance assessment system can be generalized for a specific industry, it must be critically evaluated. Furthermore, the supply chain performance measurement system's composition (appropriate mix of measurements) will vary depending on the supply chain's intended competencies (agility-adaptability-alignment). This emphasizes the significance of continuously developing and enhancing supply chain measures. Because managers must analyze supply chains as a whole entity rather than on an individual basis, the selection of supply chain measurements is crucial.
Supply chain decision-makers are concentrating on building performance measurement metrics (Beamon, 1999; Gunasekaran et al., 2014). Gunasekaran et al. (2001) gave an overview of the numerous performance indicators used throughout the supply chain, as well as sources that use these measures. Researchers have linked supply chain performance to measurements in a variety of ways, including:
- Qualitative or quantitative
- Quality, affordability, delivery, and flexibility
- Cost, quality, resource utilization, flexibility, visibility, trust, and inventiveness are all factors to consider (Chan, 2003).
- Resources, outcomes, and flexibility
- Efficiencies in supply chain collaboration, coordination, and configuration (Hieber, 2002);
- Agarwal et al. (2006) modelled the metrics of lean, agile, and leagile supply chains.
- supply chain essential performance measurements and metrics (Gunasekaran and Kobu, 2007);
- scoring approach
- Sustainability/green (Clift, 2003; Hervani et al., 2005); tangible/intangible (Park et al., 2005; Saad and Patel, 2006);
The bulk of supply chain measurements, according to Cuthbertson and Piotrowicz (2011), are financial and quantitative (cost, customer, responsiveness, and productivity), rather than qualitative. Practitioners have given less rewards and measurements at the strategic level compared to operations and individual processes, according to Chow et al. (1994). There aren't many review papers on logistics and supply chain performance measures and metrics (Gunasekaran and Kobu, 2007). The writers can deduce from the above highlighted aspects that scholars have viewed supply chain performance from a variety of approaches. The researchers' viewpoint offers a fresh take on supply chain management (SCM). The researchers' viewpoint can be expressed in terms of the supply chain's perceived nature.
2.2 Financial Metrices
The benefits and drawbacks of a performance measuring system are numerous. However, according to Guba and Lincoln, (2015), measuring financial success is crucial for businesses. Additionally, using an appropriate performance measuring system enhances financial performance (Tangen, 2004). More specifically, it is widely acknowledged that a company's financial success is greatly impacted by the performance of its supply chain (Shi and Yu, 2013). The issues that supply chain financial managers face are various. These difficulties involve utilizing technology, strategies, and solutions to increase financial outputs (Johnson and Templar, 2007). Bullinger et al. (2002) assert that measuring financial performance is essential for business success. Multiple financial statements and reporting methods have been established by numerous businesses to evaluate the success of their supply chains. But it appears that these efforts are insufficient (Bullingeret al., 2002). Financial performance measurement is associated with a variety of words and criteria. For instance, a supply chain's financial viewpoint seeks to determine if it is competitive to meet consumers' needs (Hofmann, 2005). Similar to this, financial metrics indicate a supply chain's overall profitability and growth rate (Kaplan, 1988). Cost may also be used in part to build financial indicators to evaluate the performance of supply networks. Total inventory expenses, total logistics costs, information technology costs, and material acquisition costs are some of the cost's component costs.
It may be evaluated by totaling up logistical expenses, which is more closely tied to financial performance evaluation (Engblom et al., 2012). A supply chain has several flows, including those for information, money, and goods (Chopra and Meindl, 2007). Determining the many levels of approaches and strategies that contribute to these flows is therefore crucial (Cavinato, 1992). As previously indicated, many businesses still favor using financial metrics to evaluate the effectiveness of their supply networks (Kaplan and Cooper, 1998). As per Friemann et al. (2012), who use earlier literature as an example, many businesses are ill-equipped to deal with financial problems in supply chains, such as working capital constraints. Making connections between operational and financial strategies to reduce the amount of employed capital is stressed in this respect (Simpson and Kohers, 2002). However, the supply chain's performance indicators still do not directly correlate with financial objectives like service level and capital cost (Gomm, 2010). Shi and Yu (2013) categorize financial success metrics of SCM into market-based and accounting-based groups. The typical financial performance indicators used in SCM are as follows:
Material costs
Line of sight on raw materials is essential for materials planning, which encompasses logistics, inventory and warehouse management, and customer fulfillment. Manufacturing factors including make-to-stock or make-to-order, production time, and a buffer for quality replacements must be taken into consideration while designing materials. Additionally, it takes inventory into account, as well as precise supply and demand forecasts, product shelf life, seasonal fluctuations, perishability, and operational unpredictability (Keebler, 2015). The cost of quality is taken into account, especially when sourcing reductions may result in expenditures down the road. The production and supply cycle must be supported by the material planning so that it is enough to fulfill orders, address quality concerns, and have a buffer or safety stock. This buffer allows for production and delivery delays, last-minute purchases, and quality replacements to keep consumers satisfied. The purchasing dependencies, such as lead times and import taxes, must also be taken into account. Customers must ultimately be satisfied, and frequent out-of-stock situations, subpar products, shoddy workmanship, erratic delivery schedules, and exorbitant prices will turn away customers and hurt company.
Cash to Cash time
Cash-to-Cash Cycle time is the amount of time (in days) between purchasing a company's inventory and collecting accounts receivable for the sale of that goods. In most cases, a business purchases inventory on credit, which results in accounts payable. The inventory will subsequently be sold by the business on credit, creating accounts receivable. Therefore, cash is not received until the business settles its accounts payable and then collects its accounts receivable. The period between a cash spend and a cash recovery is therefore calculated by the cash conversion cycle. This measure is internal in nature (cash utilization). One of the most effective company/supply-chain metrics is this one. This is so that it can show the performance of both lead time and inventory. It is crucial for capital fund companies in particular since the longer your C2C cycle time, the more of your working capital is consumed by it. Additionally, it may be used to illustrate how commercial terms and conditions (T&Cs) affect an organization's overall performance (Keebler, 2015). The majority of corporations' annual reports include information on the inventory days of supply, DSO, and DPO components of this statistic. We utilize this to create a high-level benchmark of competitors' businesses or business processes. No value stream contains any waste in a strictly Lean system. Products are produced and sent to the customer only when they are "pulled," and they are made by production systems that operate continuously without relying on inventory. No raw materials are purchased or processed until a consumer requests a finished product. Once a customer receives the product or service they ordered, they are immediately billed and paid. It is a just-in-time structure in its optimal state from the start of the supply chain through the customer's receipt and payment. In this instance, the lean producer pays both its customers and suppliers upon delivery. There are zero receivables, inventory, and payables and thus zero day cash-to-cash cycle time (Lapide, 2018). Although a zero-day cash-to-cash cycle is truly Lean, your business approaches its best attainable state gradually by reducing the cycle times it originally displays.
Working Capital
When it comes to controlling working capital across their business, head office treasury and finance departments frequently find themselves in a challenging situation (Lapide, 2018). Although they are essential in the provision of liquidity, they can have little control on how effectively the working capital process they fund operates. A badly managed working capital cycle will eventually have a negative impact on profitability over time, and if treasury is necessary to cover gaps in funding, external interest costs will rise. In a corporate setting, the words working capital management and cash management are frequently used interchangeably. This may be a little deceptive because, despite their tight ties, working capital management encompasses more than just cash. Therefore, to start improving working capital, head office controllers and treasurers must first comprehend the behavior of the short-term assets and liabilities that power the process, particularly accounts payable, accounts receivable, and inventory. The working capital of businesses is greatly influenced by the procurement teams, who, for the most part, oversee the stock levels that organizations maintain. The top spenders and those in charge of the largest budgets are often in procurement for a manufacturing-based company with significant raw material needs.
Perfect Order Index
Every order that complies with every criterion is referred to be perfect: delivery of the appropriate product, in the right amount and quality, from the right source to the right destination, in perfect condition, at the predetermined time, and with the required paperwork. It is required to meet a number of criteria in order to produce a high quality in this respect, such as, for instance: accuracy in order completion, thorough documentation, orders delivered on time and in excellent condition, error-free invoicing, and an efficient payment procedure (Collis and Hussey, 2013). Consequently, significant cooperation amongst all pertinent links and coordination across various stages are required for faultless order fulfillment. Few supply chains can point to notable successes in this field. The best companies at the time were able to complete orders properly in roughly 50–55 percent of situations, compared to less than 20 percent for the great majority of enterprises, according to a 1996 article by Bowersox and Closs. AMR Research found that high levels of faultless order fulfillment are positively connected with rising sales revenue, profitability, and ROA (Lapide, 2018).
A flawless order should not be viewed too idealistically or naively when used to measure the effectiveness of a supply chain. This is undoubtedly a trustworthy technique for assessing the supply chain's capacity for flexibility. Unfortunately, it doesn't provide any answers to queries about the effectiveness attained within the chain. However, performance is crucial since it's not only about how well customers' expectations are met; it's also about how much it costs. The order may be fulfilled via any method, however when doing so results in extremely high expenses associated with unconventional practices, it is no longer as attractive. Perfect order is not the best assessment tool when performing non-standard procedures that incur extra costs, such as those associated with fixing mistakes or taking precautions to prevent delays in order fulfillment. The genuine image of the situation in the supply chain is frequently distorted by such unreported actions. The inability to analyze problem sources or create clear strategies as a result limits continual progress. Utilizing an effective perfect order in this situation sounds like an intriguing idea (Lee, 2015). Along with the study of satisfying customer expectations, a new assessment of how frequently operations that don't appear in the standard procedure are carried out and the added costs resulting from those operations is also included. Such metrics and indicators examine the supply chain from the perspective of the consumer as well as internal procedures in terms of costs.
Inventory turnover
The inventory turnover ratio is a widely used indicator of how effectively a company manages its assets. As was already mentioned, reducing inventory holdings lowers overhead expenses and boosts an organization's profitability. Units sold divided by units on hand should be used to compute the inventory turnover ratio. However, as the financial statements themselves only record monetary valuations, external assessments of inventory turnover must rely on the metrics for documented valuations.
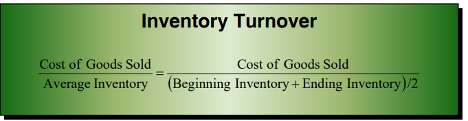
Although the method appears simple to implement, there are various factors to take into account before calculating the turnover rate of an inventory (Burns, 2017). While a company's production unit normally focuses on the inventory turnover rate in terms of how many products are actually withdrawn from the inventory, when utilized for business managing, the inventory turnover rate is focused on how many goods are sold. Additionally, the levels of incoming and departing inventory must be equal in order to produce a trustworthy estimate of the genuine inventory turnover rate across the time period used to compute the average inventory (Collis and Hussey, 2013). Understanding how to value items with dynamic purchase prices is important for calculating the inventory turnover rate. Consistency is key in this area in order to have a correct inventory turnover rate. First-in, first-out (FIFO) and last-in, first-out (LIFO) are two often used techniques for valuing inventory (LIFO). When using FIFO, a business anticipates that the cost of consuming an item will be the same as the cost of the first item added to inventory. The price utilized for inventory value in the case in figure 5 would be 5 SEK using FIFO. With LIFO, the inventory is assessed using the price of the most recent item to be added. Another approach is to determine the average inventory value using a weighted average that takes into account all previous purchasing prices.
2.3 Materials and Methods
The research was carried out in Zambia, which is a lower middle-income country. The study utilized quantitative method. For this study the research randomly selected 50 procurement professionals from Beverage manufacturing industry. A sample size is the exact number of elements that was subjected to research questions (Kothari, 2004). The sample size was calculated by the use of Slovin’s Formula (Ariola 2006)
n = N / (1 + Ne2)
Where,
N = population
n = number of samples and;
e = error tolerance.
In the current study, a confidence level of 90.0% implying that the margin of error entertained was 0.05. Using Slovin's Formula, the sample size will thus be:
107/ (1 + (107 * 0.12)) = 52
According to Kothari (2004); a sample size of at least 30 when N is large is adequate for a research. The sample size (52) is therefore considered adequate for this study. In this research, the collected data was cleaned, coded and analyzed using a Statistical Package for Social Sciences (SPSS) version 20. This tool was able to allow the researcher to organize data and output descriptive measures which include percentages in order to make it easier for interpretation and drawing of conclusions.
3.0 Findings
3.1 What are the main financial matrices used to evaluate supply chain performance?
The key financial matrix identified for assessing supply chain performance is as follows.
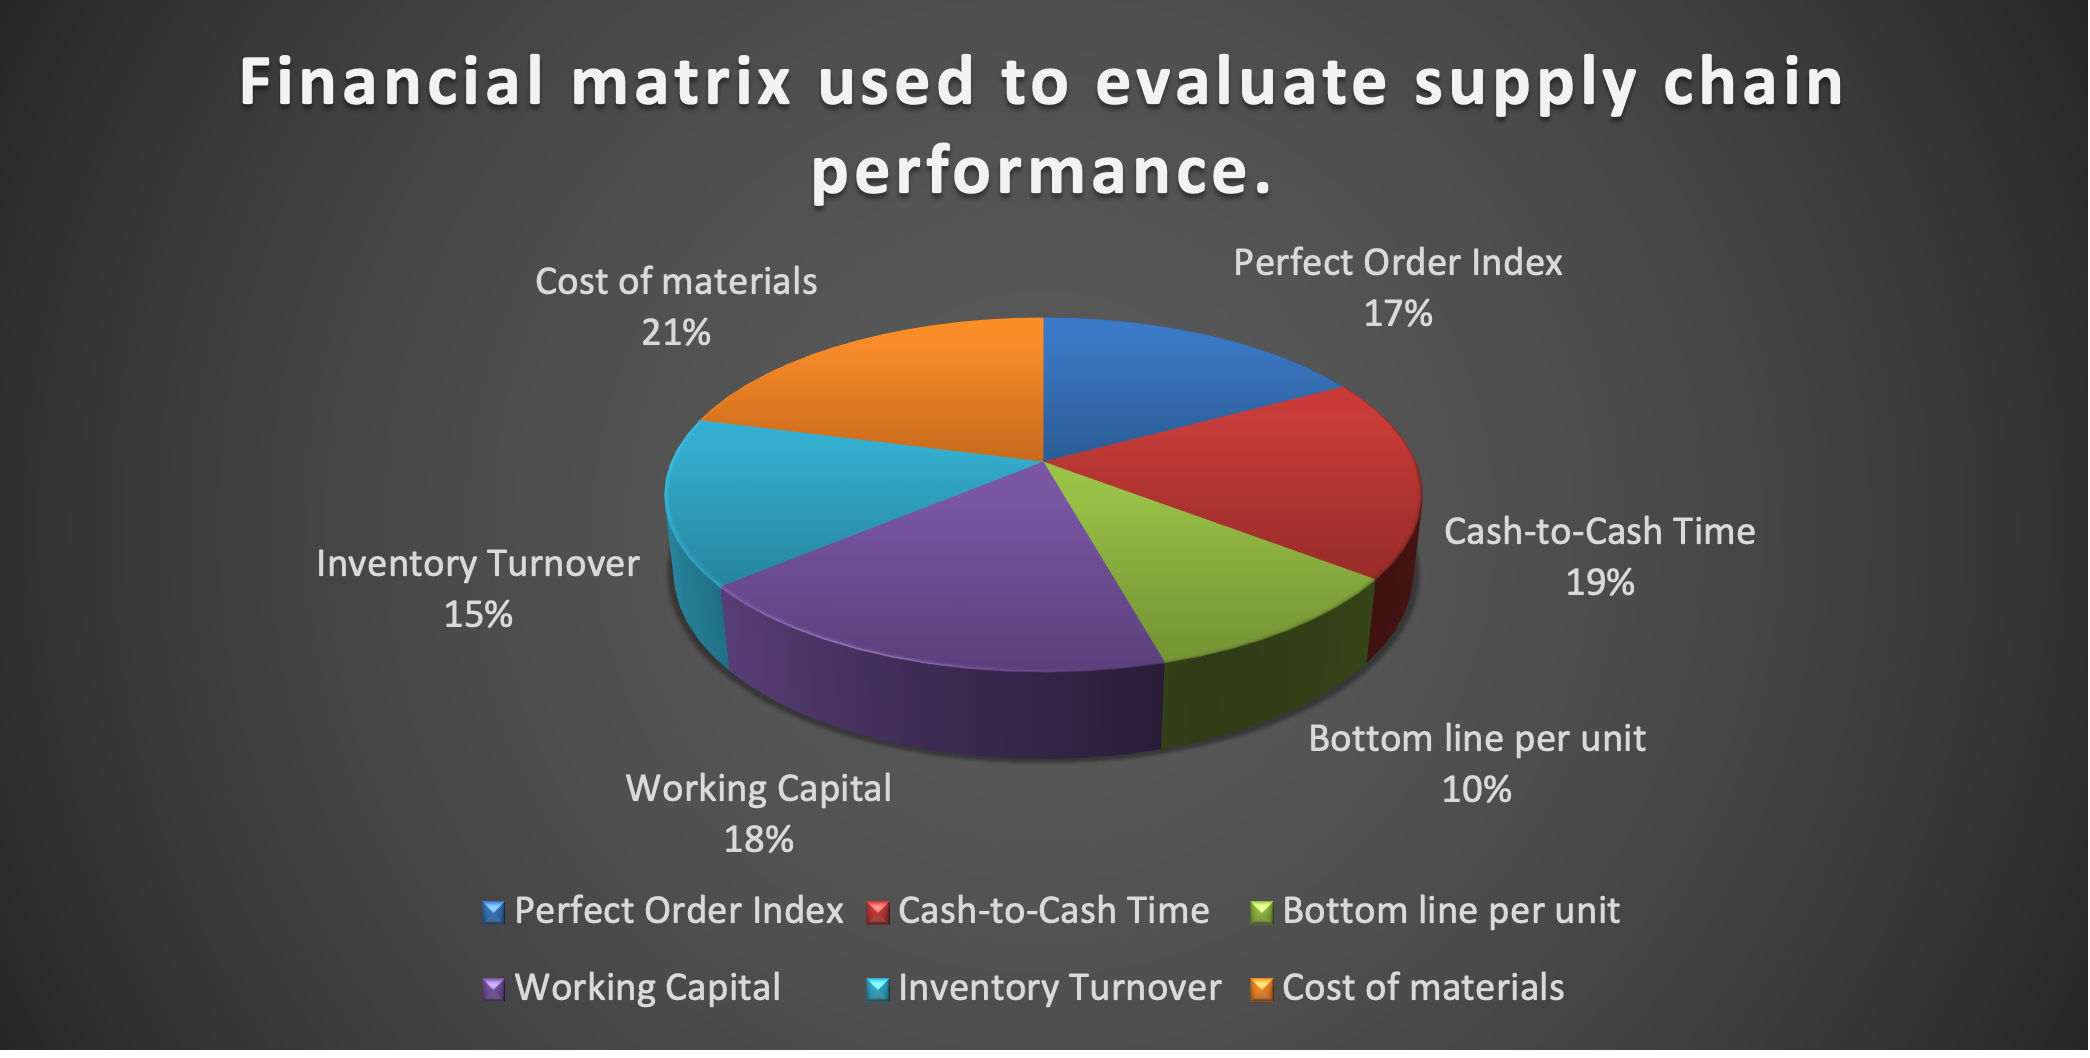
Figure 3.1's findings demonstrate that, at 21%, cost of materials was the primary financial criterion utilized by businesses to assess the success of their supply chains. Working capital came in third at 18% and was followed by cash-to-cash time at 19% as the primary financial metrics used by businesses to assess supply chain performance. At 17%, perfect order was the fourth most important financial criteria used by businesses to assess the effectiveness of their supply chains. The fifth most important financial indicator used by businesses to assess the effectiveness of their supply chains was inventory turnover, which was 15%. The least popular financial statistic was bottom line per unit.
3.2 What are the characteristics of a good performance measure?
The following were found to be the characteristics of a good performance measure in supply chain management.
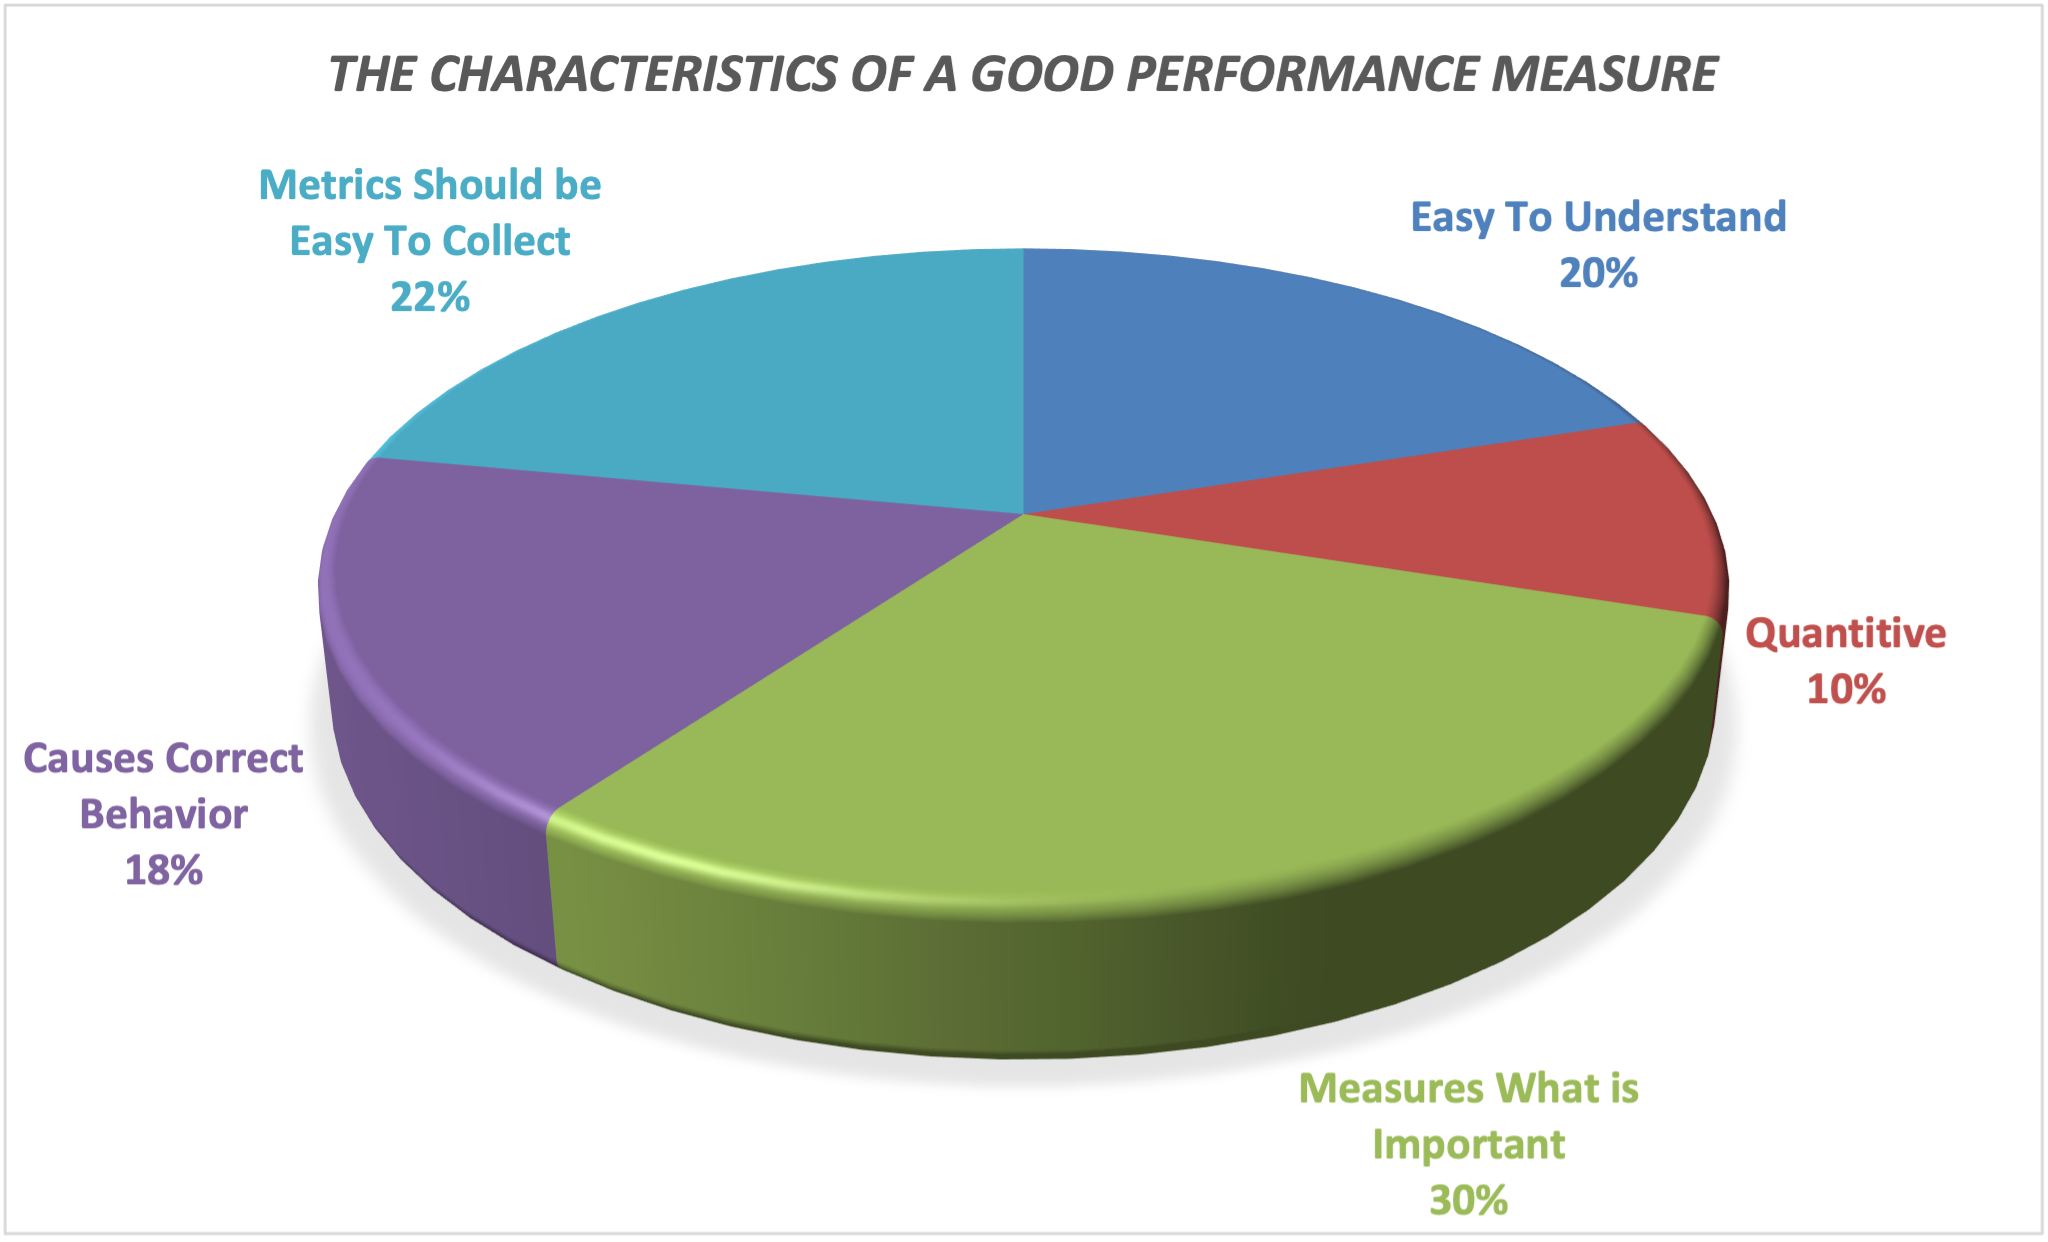
According to the findings, 22% of the participants said that metrics should be simple to gather. This is so because sometimes businesses use intricate performance indicators that take a lot of time to gather and may interfere with line employees' workdays. These kinds of measures should be avoided since this is unhelpful. Additionally, the study's findings (30%) shown that an effective performance assessment should be able to capture what matters. This because Some measures may appear to be significant, but when the data is reviewed, the metric's applicability may be in doubt. Important data must be measured by a performance indicator on which business choices are based. As per results, good performance measurements should be easy to understand (20%). Any person who looks at a metric should be able to understand it without any difficulty. It should be obvious what the metric is measuring and how it was arrived at. Additionally, the survey found that right conduct should be caused by good performance measures (18%). A good performance statistic should prompt the user to respond appropriately. For instance, if a statistic indicates how many orders are handled each day, the right course of action will improve the amount processed. However, there are situations when the measure on its own might motivate the user to act, albeit at the expense of other areas. For instance, if the warehouse personnel is evaluated based on how many moves they make each day, they may boost this number at the expense of loading vehicles and processing orders.
4.0 Conclusion
According to the study, cost of materials accounted for 21% of the financial metrics used by businesses to assess supply chain effectiveness. As the main financial parameter used by firms to evaluate the effectiveness of their supply chains, working capital came in third with 18 percent, followed by cash-to-cash time with 19 percent. Perfect order ranked fourth in importance among the financial factors considered by companies when evaluating the efficiency of their supply chains, with a 17 percent weighting. Inventory turnover, at 15%, was the fifth-most significant financial indication used by enterprises to evaluate the efficiency of their supply chains, while bottom line per unit was the least relevant financial metric. According to the results, 22% of participants agreed that metrics should be easy to collect. According to the study's findings, which showed that superior performance measurements should promote the proper conduct, a good performance measurement should also be able to determine what is relevant (18 percent).
5.0 Recommendations
It is important that organizations develop financial metrices that will reflect the true position of the supply chain as this help in improving the entire supply chain of the organization. The responding organizations must utilize customer and quality performance metrics for setting strategic goals, identifying areas for improvement, developing action plans, and other performance measurement and evaluation purposes. They should also believe these performance measures to be of a high caliber. The responding organizations should utilize employee and supplier performance measures for creating strategic goals, evaluating performance, identifying areas for improvement, and developing action plans. They also believe these performance measurements to be of a high caliber.
Agarwal, A. & Shankar, R. (2005). “Modeling Supply Chain Performance Variables,” Asian Academy of Management Journal, 10(2), 47-68
Beamon, B.M. and Chen, V.C.P. (2001) ‘Performance analysis of conjoined supply chains’, International Journal of Production Research, Vol. 39, No. 14, pp.3195–3218.
Bititci, U.S., Carrie, A.S. and McDevitt, L. (2018) ‘Integrated performance measurement systems: a development guide’, International Journal of Operations and Production Management, Vol. 17, No. 5, pp.522–534, DOI: 10.1108/01443579710167230.
Bhagwat, R. & Sharma, M. K. (2007). “Performance Measurement of Supply Chain Management: A Balanced Scorecard Approach,” Journal of Computers and Industrial Engineering, 53(1), 43-62.
Burns, R. (2017). Introduction to research methods (3rd Edn.). Melbourne: Longman.
Cohen, L., Manion, L., & Morrison, K. (2017). Research methods in education (6th ed.). New York, NY: Routledge.
Collis, J. and Hussey, R. (2013), Business Research: a practical guide for undergraduate and postgraduate students, second edition. Basingstoke: Palgrave Macmillan.
Guba, E. G., & Lincoln, Y. S. (2015). Paradigmatic controversies, contradictions, and emerging confluences. In N. K. Denzin & Y. S. Lincoln (Eds.), The Sage handbook of qualitative research (3rd ed., pp. 191–215). Thousand Oaks, CA: Sage.
Gunasekaran, A., Williams, H. J. & McGaughey, R. E. (2014). “Performance Measurement and Costing System in New Enterprise,” Journal of Technovation, 25(5), 523–33.
Gunasekaran, A., Patel, C. & Tittiroglu, E. (2001). “Performance Measures And Metrics in a Supply Chain Environment,” International Journal of Operations and Production Management, 2(1-2), 71–87.
Keebler, J. S. (2015). 'Measuring Performance in the Supply Chain,' Journal of Supply Chain Management, SAGE Publications, California.
Lapide, L. (2018). “What about Measuring Supply Chain Performance?,” AMR Research, ASCET - White Paper, 2(15), 287-297
Lee, S. Y. (2015). The effects of green supply chain management on the supplier’s performance through social capital accumulation. Supply Chain Management: An International Journal.
Neely, A., Gregory, M. and Platts, K. (1995) ‘Performance measurement system design’, International Journal of Operations and Production Management, Vol. 15, No. 4, pp.80–116.
Neely, A., Adams, C. & Crowe, P. (2001). “The Performance Prism in Practice,” Journal of Measuring Business Excellence, 5(2), 6 -13.
Neely, A., Gregory, M. and Platts, K. (2005) ‘Erratum’, International Journal of Operations and Production Management, Vol. 25, No. 12, pp.1228–1263.
Wang, C., Heng, M. and Chau, P. (2007) Supply Chain Management – Issues in the New Era of Collaboration and Competition, Idea Group Publishing, London.
Author: McGerald Mvula, student LIGS University
Approved by: Amr Sukkar, lecturer LIGS University